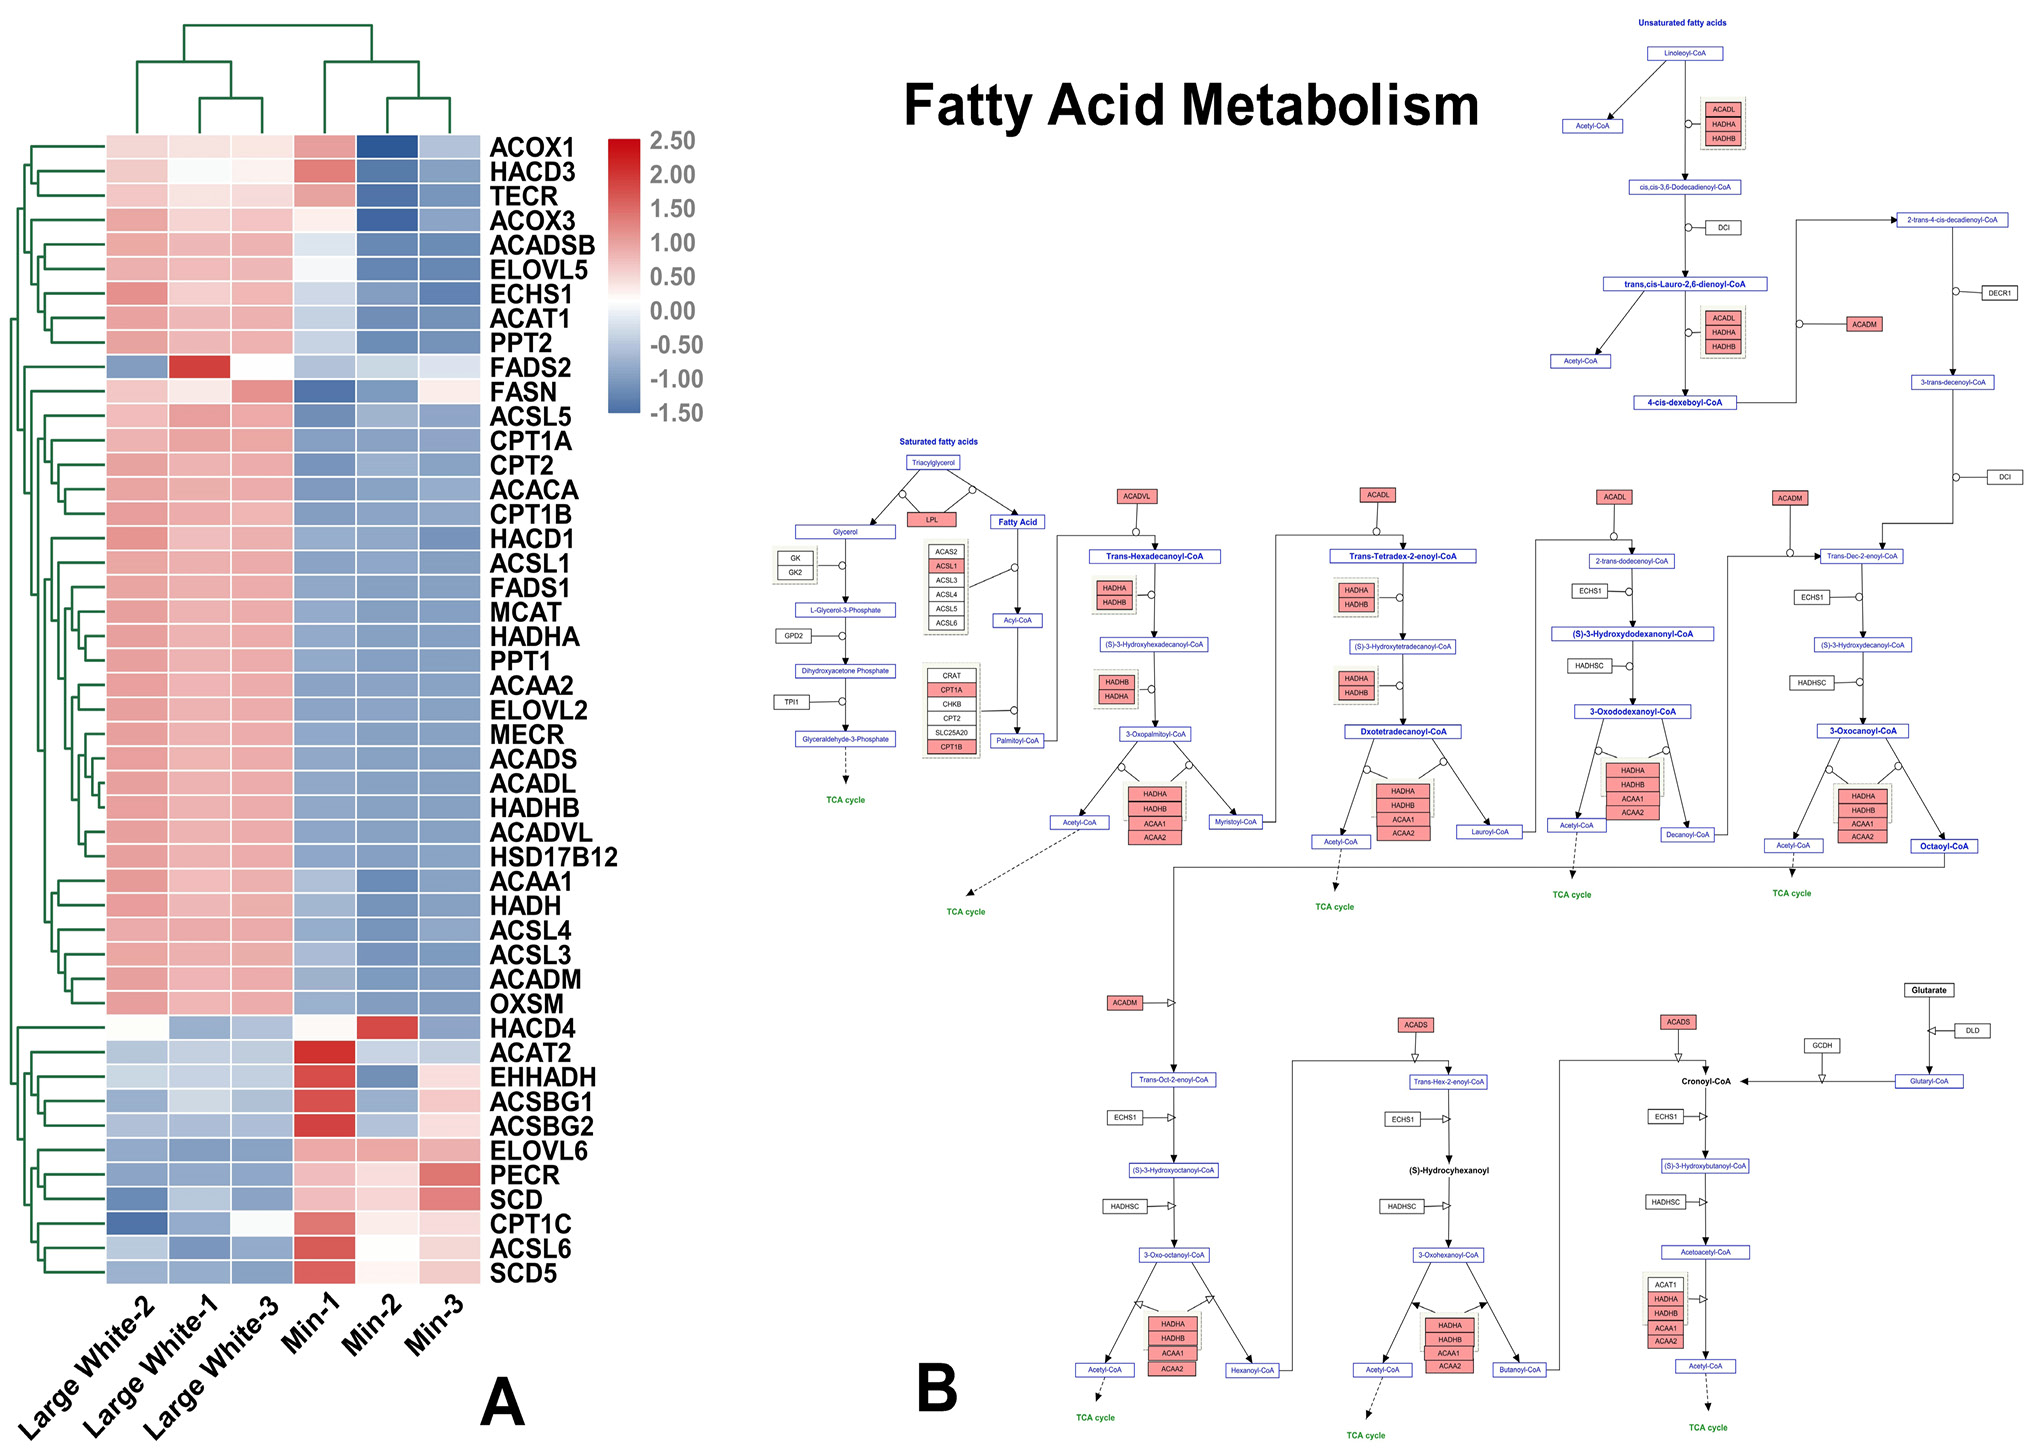
Fig. 6.
qRT-PCR array results for the fatty acid metabolism signaling pathway in two pig breeds. (A) A heatmap of all qRT-PCR array genes in the fatty acid metabolism signaling pathway. The colors (blue, black, and red) represent gene expression levels in the LD of two pig breeds (Min, and Large White); (B) Colored map of the fatty acid metabolism signaling pathway. Upregulated and downregulated genes are colored in red and blue, respectively.